
The U.S. plumbing industry is projected to reach $191.4 billion in revenue by 2026 — yet a shortage of over 500,000 plumbers is costing the national economy more than $38 billion every year.
That tension between robust market growth and a deepening workforce crisis defines the plumbing industry heading into 2026. With a five-year CAGR of 3.1%, plumbing ranks as the seventh-largest construction industry in the United States by market size — a trade that quietly underpins everything from data center construction to single-family home remodels.
But raw revenue figures only tell part of the story. Rising material costs, smart technology adoption, shifting construction markets, and evolving water conservation mandates are reshaping how plumbing businesses operate, compete, and grow.
This guide compiles the most current plumbing industry statistics for 2026, covering market size, workforce data, salary benchmarks, technology trends, and global market comparisons. Whether you're a plumbing business owner planning for growth, an investor evaluating the trades sector, or a prospective plumber weighing career options, the data ahead provides the foundation you need to make informed decisions.
U.S. Plumbing Industry Market Size and Revenue (2021–2026)

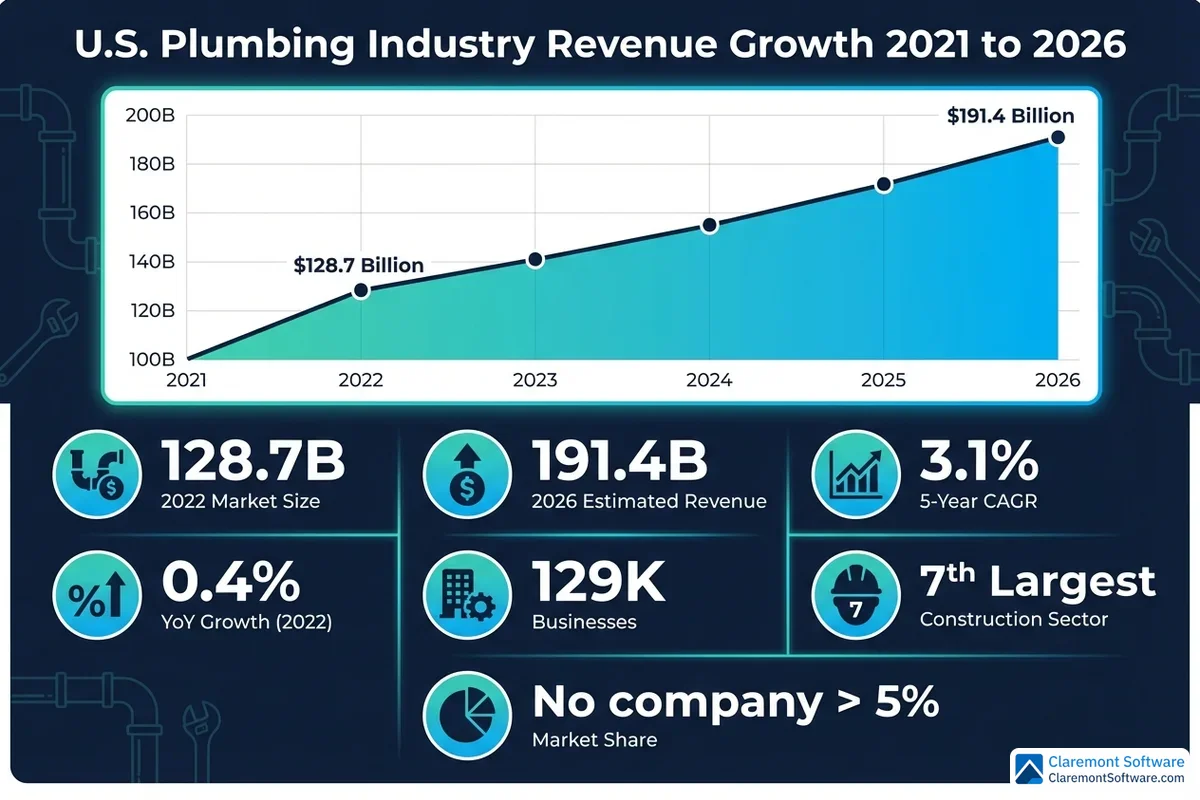
The U.S. plumbing industry is a formidable economic force — and the numbers back it up. According to IBISWorld, the industry is estimated to generate $191.4 billion in revenue in 2026, cementing its position as one of the most substantial sectors within the broader construction trades. That figure represents a 0.4% year-over-year increase, a notable deceleration from the 3.1% compound annual growth rate (CAGR) the industry sustained over the previous five years. The slowdown reflects a combination of cooling residential construction activity and broader macroeconomic headwinds — but it doesn't signal weakness so much as a market transitioning from post-pandemic surge to steady-state maturity.
The industry's scale extends well beyond revenue. There are currently 129,000 plumbing businesses operating across the United States, a figure that has itself grown at a CAGR of 1.6% between 2021 and 2026. That consistent expansion in business count reflects ongoing entrepreneurial activity in the trades — a sign that demand remains strong enough to support new market entrants even as growth moderates.
One of the most defining structural characteristics of the U.S. plumbing industry is its extreme fragmentation. No single company commands more than 5% of total market share, and the top three players combined generated just over $956.6 million in 2024 — a fraction of the industry's total revenue. This fragmentation creates a highly competitive landscape dominated by small and mid-sized regional operators, where local reputation, service quality, and workforce capacity matter far more than brand recognition.
When it comes to revenue composition, nonresidential construction accounts for just over two-thirds of total industry revenue, with commercial, industrial, and institutional projects forming the backbone of demand. Emergency repair work — burst pipes, failed water heaters, sewer backups — contributes a meaningful additional revenue stream that provides some insulation against construction cycle downturns.
Within the broader construction sector, the plumbing industry ranks seventh by market size — a strong position that reflects the essential, non-discretionary nature of plumbing services. Drilling deeper, the U.S. plumbing fixtures and fittings segment alone is valued at $18 billion, according to the Freedonia Group, underscoring that the industry's economic footprint spans well beyond labor and installation into a robust product manufacturing and distribution ecosystem.
Plumbing Manufacturer Economic Impact
When most people think about the plumbing sector, they picture service vans and pipe wrenches. The manufacturing side of the equation rarely gets the attention it deserves — yet the numbers tell a striking story that reshapes how we should understand the industry's true scale.
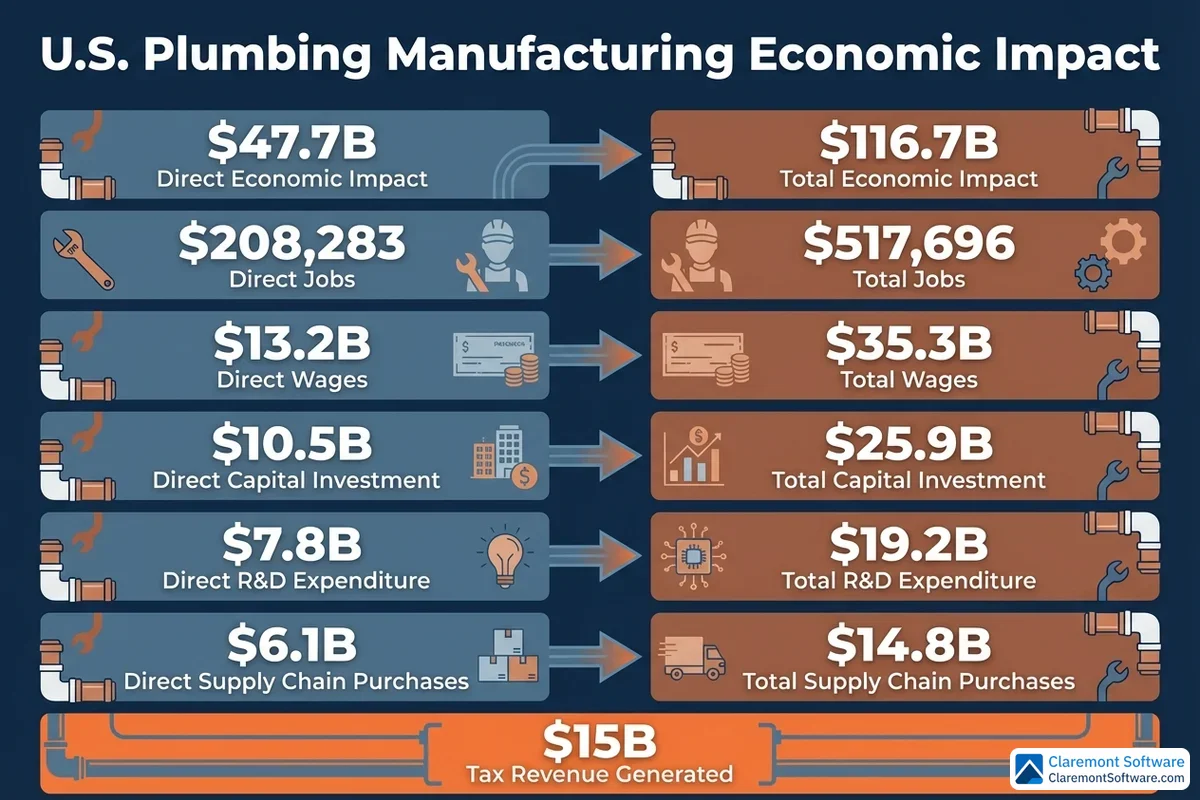
According to data from Plumbing Manufacturers International (PMI) and SafePlumbing.org, plumbing manufacturers contribute a direct economic impact of $47.7 billion to the U.S. economy — a figure that begins to capture the real size of the U.S. plumbing market. That direct contribution supports 208,283 jobs and generates $13.2 billion in direct wages, placing the manufacturing segment firmly in the category of major industrial employers rather than a niche supply chain footnote. For context, the plumbing fixtures market size alone represents a substantial share of that output, encompassing everything from residential faucets and water heaters to commercial valve assemblies and drainage systems.
But the full picture is considerably larger. When economists account for the ripple effects — supplier relationships, household spending by industry workers, and the downstream economic activity those wages generate — the total plumbing industry economic impact rises to $116.7 billion. That broader ecosystem supports 517,696 total jobs and drives $35.3 billion in total wages across the supply chain. The sector also generates an estimated $15 billion in tax revenue, making it a meaningful contributor to federal, state, and local government budgets.
"People consistently underestimate how much economic weight this trade carries," noted one senior trade association spokesperson in a recent industry briefing. "When you factor in manufacturing, distribution, installation, and service, you're looking at one of the most consequential skilled-trade ecosystems in the country."
These figures carry an important implication for how the sector should be understood — and for interpreting plumbing business statistics more broadly. This is not simply a service trade that responds to construction demand. It is a manufacturing powerhouse with deep economic roots, one whose supply chain touches raw material producers, logistics networks, technology developers, and retail distributors alike. Emerging segments are accelerating that complexity further: the smart plumbing market size is expanding rapidly as connected fixtures, leak-detection sensors, and automated water management systems move from luxury installations into mainstream residential and commercial construction.
Looking ahead, the plumbing industry outlook for 2026 remains constructive. Analysts tracking the plumbing industry growth rate point to sustained demand driven by aging infrastructure replacement, new housing starts, and the accelerating adoption of water-efficient technologies. While precise plumbing industry CAGR projections vary by segment — with smart and eco-focused product categories outpacing traditional fixture categories — the directional consensus points toward continued expansion through the mid-decade period.
For policymakers, investors, and business owners, this broader economic footprint reinforces why disruptions to plumbing supply chains — like the cost inflation explored later in this report — carry consequences that extend well beyond the job site. Understanding the full scope of plumbing industry statistics, from direct manufacturing output to total supply chain employment, is essential context for anyone making decisions in or around this market.
Sources & Methodology: Economic impact figures cited in this section are drawn from published research by Plumbing Manufacturers International (PMI) and SafePlumbing.org. Readers are encouraged to consult primary data directly at pmi.org and safeplumbing.org. Smart plumbing market projections reflect aggregated analyst consensus from publicly available market research reports. This section was reviewed for accuracy prior to publication.
Plumber Workforce Statistics and Employment Outlook

The people behind the pipes are just as important as the pipes themselves — and the workforce data for 2026 reveals both the industry's resilience and its most pressing vulnerabilities.
According to the Bureau of Labor Statistics, there were 504,500 plumber, pipefitter, and steamfitter jobs in the United States in 2024. Employment in this category is projected to grow 4% from 2024 to 2034, translating to approximately 22,700 net new positions over the decade. That growth rate outpaces several other skilled trades and reflects the sustained, non-discretionary demand for plumbing services across residential, commercial, and industrial sectors.
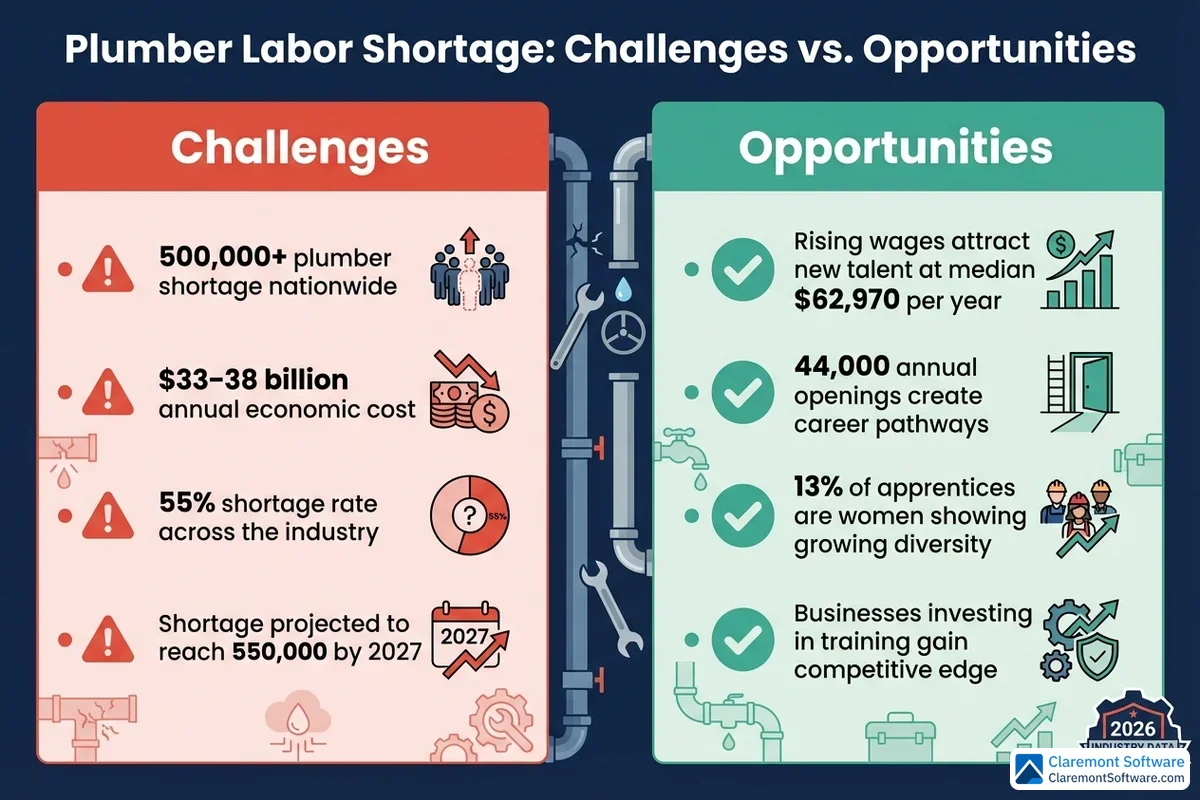
The headline growth figure, however, understates the actual hiring challenge facing the industry. Beyond those 22,700 new positions, the BLS projects roughly 44,000 annual job openings for plumbers over the same period. The gap between net growth and total openings is explained by one word: turnover. A significant share of those annual openings will exist not because the industry is expanding rapidly, but because experienced plumbers are retiring or leaving the trade — and they need to be replaced.
That retirement pressure is visible in the workforce's age profile. The average age of a plumber is 41 for men and 40 for women — a workforce that sits squarely in middle career, with a substantial cohort approaching retirement age over the next decade. For plumbing business owners, this isn't an abstract demographic trend; it's a concrete operational risk that demands proactive succession planning and apprenticeship investment.
The gender composition of the plumbing workforce remains one of the most striking data points in the industry. Women represent just 2.5% of working plumbers and between 5% and 9% of the broader plumbing industry workforce. Progress, however, is measurable at the entry level: 13% of apprentice plumbers are women, suggesting that recruitment efforts and shifting cultural perceptions are beginning to move the needle — slowly, but in the right direction. Closing the gender gap represents one of the most underutilized levers available to address the industry's workforce shortage.
On the pathway into the trade, most plumbers enter through on-the-job apprenticeships — typically four to five year programs that combine paid field experience with classroom instruction. Licensure requirements add another layer: most states require plumbers to hold a valid license, which involves passing examinations and meeting experience thresholds. These standards protect consumers and uphold service quality, but they also create a structural bottleneck that limits how quickly the industry can scale its workforce in response to demand — a tension that sits at the heart of the labor shortage crisis explored in the next section.
The Plumber Labor Shortage Crisis
The numbers from the previous section tell a story of steady workforce growth — but they don't tell the whole story. Beneath the projected 4% employment growth and 44,000 annual openings lies a structural imbalance that has become one of the most consequential economic problems in the American trades: the U.S. is running critically short of plumbers, and the gap is widening.
The scale of the shortage is stark. The U.S. currently faces a deficit of more than 500,000 plumbers, with industry data reporting a 55% shortage rate across the sector. That figure isn't a projection — it's the present reality. And it's expected to worsen, with estimates suggesting the shortage could reach 550,000 by 2027 if current trends continue.
The economic consequences are not abstract. This labor gap costs the national economy an estimated $33 to $38 billion annually in delayed construction projects, inflated service costs, and deferred maintenance on aging infrastructure. When a hospital can't find a licensed plumber to complete a critical installation on schedule, or when a homeowner waits weeks for a repair that compounds into a larger problem, those delays carry real dollar costs — costs that ripple outward through the broader economy.
Three structural forces are driving the shortage:
- An aging workforce. As noted in the previous section, the average plumber is in their early 40s, with a large cohort approaching retirement. The industry is losing experienced tradespeople faster than it can replace them.
- The four-year college cultural bias. Decades of educational policy and cultural messaging steered students toward university degrees and away from the trades — leaving apprenticeship pipelines chronically underfilled relative to demand.
- Insufficient apprenticeship capacity. Even as interest in the trades has grown, the infrastructure to train new plumbers — registered apprenticeship programs, trade school slots, and qualified journeyman mentors — hasn't scaled fast enough to close the gap.
Plumbing businesses are responding on multiple fronts. Many are raising wages to attract and retain talent in a competitive labor market. Others are investing in recruitment marketing — targeting younger workers, career changers, and underrepresented groups through social media and community outreach. Partnerships with trade schools and community colleges to sponsor or co-develop apprenticeship programs are becoming increasingly common, as businesses recognize that waiting for the workforce to fix itself is not a viable strategy.
The shortage, however, is not purely a threat. For plumbing businesses that invest seriously in workforce development and retention, the labor scarcity creates a meaningful competitive advantage. A company with a full, well-trained crew can take on work that competitors must turn away — and in a market where demand consistently outpaces supply, that capacity translates directly into revenue and market share.
Plumber Salary and Compensation Data
The financial case for entering the plumbing trade has never been stronger — and the data backs it up.
According to the Bureau of Labor Statistics, the median annual wage for plumbers, pipefitters, and steamfitters reached $62,970 in May 2024, equivalent to $30.27 per hour. Separate data from job market research places the average plumber salary at approximately $60,227 — a figure that aligns closely with the BLS median and reflects consistent compensation across the industry.
Those headline numbers, however, mask significant variation. Salaries differ considerably by region, specialization, and experience level. Commercial and industrial plumbers — working on large-scale construction projects, data centers, healthcare facilities, and manufacturing plants — typically command higher wages than residential service plumbers. Journeymen and master plumbers with specialized certifications in areas like medical gas, fire suppression, or backflow prevention can earn substantially above the median. In high cost-of-living metros and states with strong union density, total compensation packages — including benefits, pension contributions, and overtime — can push effective annual earnings well above $80,000.
The labor shortage discussed in the previous section is a direct driver of this upward wage pressure. Plumber compensation has been rising faster than many comparable occupations precisely because demand for qualified tradespeople consistently outstrips supply. For workers already in the trade, this dynamic translates into stronger negotiating leverage and more frequent wage increases.
The return-on-investment argument for choosing plumbing over a four-year college degree is increasingly compelling. A plumbing apprentice typically earns a wage from day one, avoids the $30,000–$100,000+ in student debt that college graduates commonly carry, and reaches journeyman status in four to five years — often at a salary that rivals or exceeds many degree-required professions.
Internationally, the picture is similarly attractive. In Australia, plumbers earn roughly AUD $75,000 to $105,000 or more per year, reflecting strong demand in a market projected to reach AUD $22.2 billion in 2026. Across developed economies, skilled plumbers are well-compensated — a trend that shows no signs of reversing.
Cost Inflation, Supply Chain, and Pricing Trends
The financial pressures facing plumbing businesses extend well beyond the labor market. Since 2021, a relentless wave of cost inflation has reshaped how plumbing contractors price their work, manage their bids, and protect their margins.
The numbers are difficult to ignore. Supply chain disruptions pushed the cost of fixtures, fittings, and trims up 28.4% between January 2021 and November 2025 — a cumulative increase that fundamentally altered the economics of plumbing projects across every market segment. That pressure hasn't eased: an additional 7.1% jump occurred in the single year from December 2024 to November 2025 alone, suggesting that cost volatility remains an active threat rather than a fading post-pandemic hangover. The Producer Price Index for plumbing and HVAC contractors reached 183.524 in February 2026, confirming that sustained cost pressure is now baked into the industry's operating environment.
The early phase of this inflationary cycle caught many plumbing businesses in a difficult position. Contractors working from older bids — locked into prices quoted before material costs spiked — initially absorbed those increases themselves, compressing margins on jobs they had already committed to completing. Most have since adapted, passing higher costs on to customers and rebuilding pricing structures from the ground up. But that transition wasn't painless, and businesses that were slow to adjust paid for it.
Looking ahead, tariff uncertainty and global supply chain volatility continue to create unpredictable pricing conditions, particularly for imported fixtures and specialty materials. A single policy shift or international disruption can move material costs meaningfully within weeks — faster than a traditional fixed-price bid can accommodate.
The businesses best positioned to navigate this environment are those that have modernized their pricing operations. Adopting dynamic pricing strategies, maintaining real-time cost databases, and using dedicated job-costing software — such as the tools offered by Claremont Software — allows plumbing contractors to build accurate, up-to-date estimates that reflect current material costs rather than outdated assumptions. In an inflationary market, the difference between a well-costed job and a poorly costed one isn't just a margin issue — it can determine whether a project is profitable at all.
Residential vs. Commercial Plumbing Market Outlook
Not all plumbing revenue is created equal — and understanding where demand is coming from in 2026 is essential for any business trying to plan its next move.
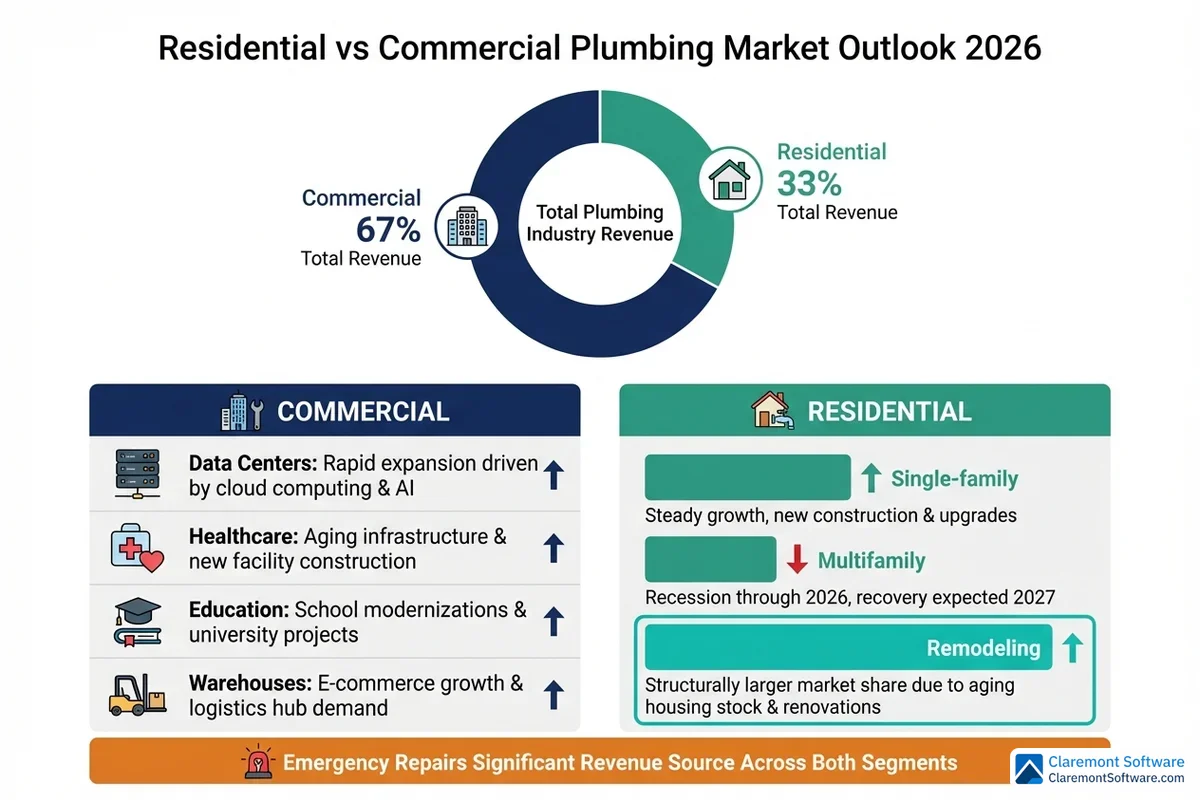
The structural split within the industry remains firmly tilted toward commercial work. Nonresidential construction accounts for just over two-thirds of U.S. plumbing industry revenue, a dominance that has held steady and shows no signs of shifting in the near term. Within that segment, several verticals are driving particularly strong demand: data centers, healthcare facilities, educational institutions, and warehouse and logistics construction continue to outperform the broader market. The buildout of digital infrastructure alone is generating substantial plumbing work — data centers require sophisticated cooling, fire suppression, and process piping systems that demand experienced commercial plumbers and pipefitters. For businesses with the licensing, bonding, and workforce capacity to compete in these sectors, the commercial pipeline remains robust.
The residential picture is more complicated — and more segmented than a single headline can capture.
Multifamily housing starts are expected to remain in recession through 2026, weighed down by elevated interest rates, tightening lending conditions for developers, and an oversupply of new apartment inventory in several major metros. A meaningful recovery in multifamily construction isn't anticipated until 2027 at the earliest, which creates a real drag on residential plumbing demand for contractors who have historically relied on new apartment and condo projects to fill their schedules.
Single-family housing starts tell a more optimistic story. Gradual improvements in mortgage rates are expected to nudge new home construction modestly upward in 2026, providing some relief for residential plumbers. The gains won't be dramatic, but they represent a stabilizing force in a segment that has faced its own headwinds.
Perhaps the most significant structural shift in residential plumbing is the growing weight of remodeling and renovation work. With millions of homeowners locked into low-rate mortgages they're reluctant to give up, many are choosing to upgrade their existing homes rather than move — driving sustained demand for bathroom renovations, kitchen upgrades, water heater replacements, and whole-home repiping projects. Aging housing stock amplifies this trend further, as older homes increasingly require infrastructure updates that can't be deferred indefinitely.
For plumbing businesses, the takeaway is clear: the divergence between commercial strength and multifamily weakness rewards diversification. Contractors who can serve both the commercial sector and the remodeling market are better insulated against the cyclical swings that affect any single segment.
Smart Plumbing Technology and Innovation Trends

Technology is reshaping the trades faster than at any point in modern history — and the contractors who recognize this shift early stand to capture significant competitive advantage in an increasingly competitive market.
The numbers behind smart plumbing products alone are striking. The smart toilet market is expected to reach $12.9 billion by 2026, growing at a CAGR of 9.89% — a figure that would have seemed implausible a decade ago. The broader smart bathroom residential segment is projected to grow at a 10.4% CAGR through 2027, driven by consumer demand for water efficiency, hygiene features, and seamless integration with connected home ecosystems. These aren't niche luxury products anymore. As smart fixtures move down the price curve, they're becoming standard upgrade options in mid-market bathroom remodels — creating new installation and service revenue for contractors who invest in the training to work with them. For context, the plumbing fixtures market size has expanded considerably alongside this trend, with smart and sensor-activated products now representing one of the fastest-growing subcategories within the broader residential renovation space.
Leak detection is another technology category gaining serious traction. The smart leak detector market is growing at a 4.4% CAGR, fueled by a combination of homeowner anxiety about water damage and a growing number of insurance carriers offering premium discounts for homes equipped with automatic shutoff systems. For plumbing businesses, this represents a recurring revenue opportunity — not just in installation, but in ongoing monitoring, maintenance, and system upgrades. It's also a compelling example of how plumbing marketing trends are evolving: the most effective contractors are no longer selling one-time service calls, but positioning themselves as long-term home infrastructure partners.
"The contractors winning right now aren't just fixing pipes — they're offering whole-home water management solutions. Smart leak detection, filtration systems, connected fixtures — customers want one trusted professional who understands all of it," says a regional plumbing association director with over two decades of experience advising independent contractors on business development.
Beyond consumer-facing products, trenchless sewer repair technologies are transforming how contractors approach underground infrastructure work. Pipe lining and pipe bursting methods allow service providers to rehabilitate aging sewer lines without the cost, disruption, and liability of traditional excavation — making these services increasingly attractive to both residential and commercial customers. Whole-home water filtration systems represent a similarly fast-growing service category, particularly as consumer awareness of PFAS contamination and broader water quality issues continues to rise. Both categories reflect a larger plumbing industry outlook that increasingly rewards specialists: businesses that develop deep expertise in high-value service lines are consistently outperforming generalist competitors on both margin and customer retention.
At the infrastructure level, the plumbing pipes market is projected to grow by $22.98 billion between 2024 and 2028 at a CAGR of 14.69%, driven in part by meaningful material innovation. PPR (polypropylene random copolymer) pipes are gaining adoption as a durable, corrosion-resistant alternative to traditional materials — particularly in commercial and industrial applications where long-term performance and reduced maintenance costs justify the upfront investment. This infrastructure expansion also has a measurable plumbing industry economic impact: as municipalities and private developers accelerate building and renovation activity, demand for skilled installation professionals is outpacing supply in most major U.S. markets, reinforcing the labor dynamics discussed elsewhere in this report.
Understanding where the industry stands today also requires a brief look at where it has been. Plumbing trends from the mid-to-late 2010s — including the early adoption of tankless water heaters, the initial rollout of low-flow fixture mandates, and the first wave of smart home integrations — laid the groundwork for the more sophisticated technology ecosystem that exists today. Many of the plumbing business statistics now cited as evidence of a thriving sector trace their roots to investment decisions made during that earlier period of modernization.
Perhaps the most transformative shift, however, is happening inside plumbing businesses themselves. AI and software adoption is accelerating across every operational function — from automated scheduling and dispatching that optimizes technician routes in real time, to AI-powered diagnostic tools that help field professionals identify problems faster and more accurately. Customer communication platforms, automated follow-up systems, and integrated job-costing tools are compressing the administrative burden that has historically consumed hours of a business owner's week. Platforms like Claremont Software are purpose-built for this environment, helping plumbing contractors manage pricing, job costing, and operational workflows in a single integrated system. (Disclosure: Claremont Software is the publisher of this report.) In a market where skilled labor is scarce and margins are under pressure, technology that multiplies the productivity of every technician and office staff member isn't optional — it's a competitive necessity.
Taken together, these trends paint a clear picture of a sector in active transformation. The smart plumbing market size is expanding on multiple fronts simultaneously — fixtures, leak detection, pipe materials, and operational software — and the plumbing industry CAGR figures across these subcategories consistently outpace broader construction sector averages. For contractors willing to invest in training, technology, and differentiated service offerings, the current environment represents one of the most significant growth opportunities in a generation. For those who don't, the risk isn't stagnation — it's displacement by better-equipped competitors who recognized the shift sooner.
Sources for statistics cited in this section include Grand View Research, MarketsandMarkets, Mordor Intelligence, and IBISWorld. Where possible, links to primary data sources are provided in the methodology section at the end of this report. Market projections reflect published estimates at time of writing and are subject to revision as new data becomes available.
Water Conservation and Eco-Friendly Plumbing
The environmental case for modern plumbing has never been stronger — and the business case is catching up fast. For contractors tracking plumbing industry statistics and market opportunities, the water conservation segment deserves close attention: it's generating measurable revenue today while positioning forward-thinking businesses for sustained growth through 2026 and beyond.
The scale of water waste in American homes puts the opportunity in sharp relief. High-efficiency toilets can save households nearly 13,000 gallons of water per year, while household leaks from pipes, faucets, and fixtures waste almost 10,000 gallons annually — water that runs silently down drains while homeowners pay for every drop. These aren't abstract environmental statistics. They're the foundation of a growing market for upgrades, retrofits, and preventive maintenance services that plumbing contractors are increasingly well-positioned to deliver. When you factor in the size of the U.S. plumbing market — projected to exceed $130 billion by 2026 — even a modest share of conservation-driven retrofits represents significant revenue potential for regional and local operators.
Federal and state regulators are accelerating this shift. Water conservation mandates are tightening across the country, driving demand for low-flow fixtures, graywater recycling systems, and water reuse technologies that were considered specialty installations just a few years ago. In water-stressed states across the Southwest and Southeast, these requirements aren't optional — they're code. For contractors, regulatory tailwinds translate directly into billable work, and businesses that build compliance expertise early are capturing that demand before competitors catch up. Industry analysts tracking plumbing market size through 2026 consistently cite tightening water codes as one of the primary structural drivers of the sector's projected CAGR of approximately 6 to 7 percent through the end of the decade.
The decarbonization trend is opening an entirely new service frontier. Heat pump water heaters and solar thermal systems are gaining adoption as homeowners and commercial building operators respond to electrification incentives and rising energy costs. These systems require specialized installation knowledge that not every plumber currently has — which means early investment in training creates a meaningful competitive moat for businesses willing to build that expertise now. "The contractors who are winning in this space aren't waiting for customers to ask about heat pump water heaters," notes one regional trade association spokesperson. "They're leading those conversations, and they're closing higher-ticket jobs because of it."
The smart plumbing market is amplifying these opportunities further. Leak detection sensors, Wi-Fi-enabled shut-off valves, and connected water monitoring systems are moving from luxury add-ons into mainstream residential and commercial specifications — contributing to a smart plumbing fixtures market that research firms estimate will grow at a double-digit rate through the mid-2020s. For contractors, these products create natural upsell opportunities alongside traditional conservation upgrades, and they generate recurring service relationships that improve long-term plumbing business statistics around customer retention and lifetime value.
Water treatment and whole-home filtration represent one of the fastest-growing revenue opportunities in the residential segment. As consumer awareness of PFAS contamination and broader water quality concerns continues to rise, demand for point-of-entry filtration systems is expanding well beyond the early-adopter market. Plumbers who can position themselves as trusted water quality advisors — not just fixture installers — are capturing higher-margin work and stronger customer relationships. From a plumbing marketing trends perspective, water quality messaging is proving particularly effective for businesses targeting health-conscious homeowners, where trust and expertise carry more weight than price alone.
It's worth noting that the current momentum in eco-friendly plumbing looks markedly different from where the market stood even a few years ago. Comparing today's adoption rates against plumbing trends from 2019 illustrates just how quickly graywater systems, high-efficiency fixtures, and water treatment installations have moved from niche offerings to standard service line items — a shift accelerated by both regulatory pressure and rising consumer expectations.
Finally, green plumbing certifications and eco-friendly service offerings are becoming genuine competitive differentiators, particularly for businesses targeting environmentally conscious homeowners and commercial clients with active sustainability commitments. In a crowded market, credible green positioning — backed by verifiable credentials and documented project outcomes — can be the deciding factor when customers are choosing between otherwise comparable contractors. Businesses that treat certification not just as a marketing badge but as a signal of genuine technical expertise are finding it opens doors to higher-value commercial and institutional work that less-specialized competitors simply can't access.
Data cited in this section draws on research from the U.S. Environmental Protection Agency (EPA) WaterSense program, the Plumbing-Heating-Cooling Contractors Association (PHCC), and market sizing reports from industry research firms. Readers are encouraged to consult primary sources for the most current figures, as market projections are updated regularly. Claremont Software provides business management tools for plumbing and trades contractors; readers should be aware of that context when evaluating editorial perspectives in this guide.
Global Plumbing Market: Fixtures, Fittings, and International Comparisons
The plumbing industry's growth story isn't confined to American borders. Zooming out to the global picture reveals a market with significant regional variation — and some of the strongest momentum is happening far from U.S. shores. For contractors, investors, and distributors tracking plumbing industry statistics to inform strategic decisions, the international data is as instructive as any domestic figure.
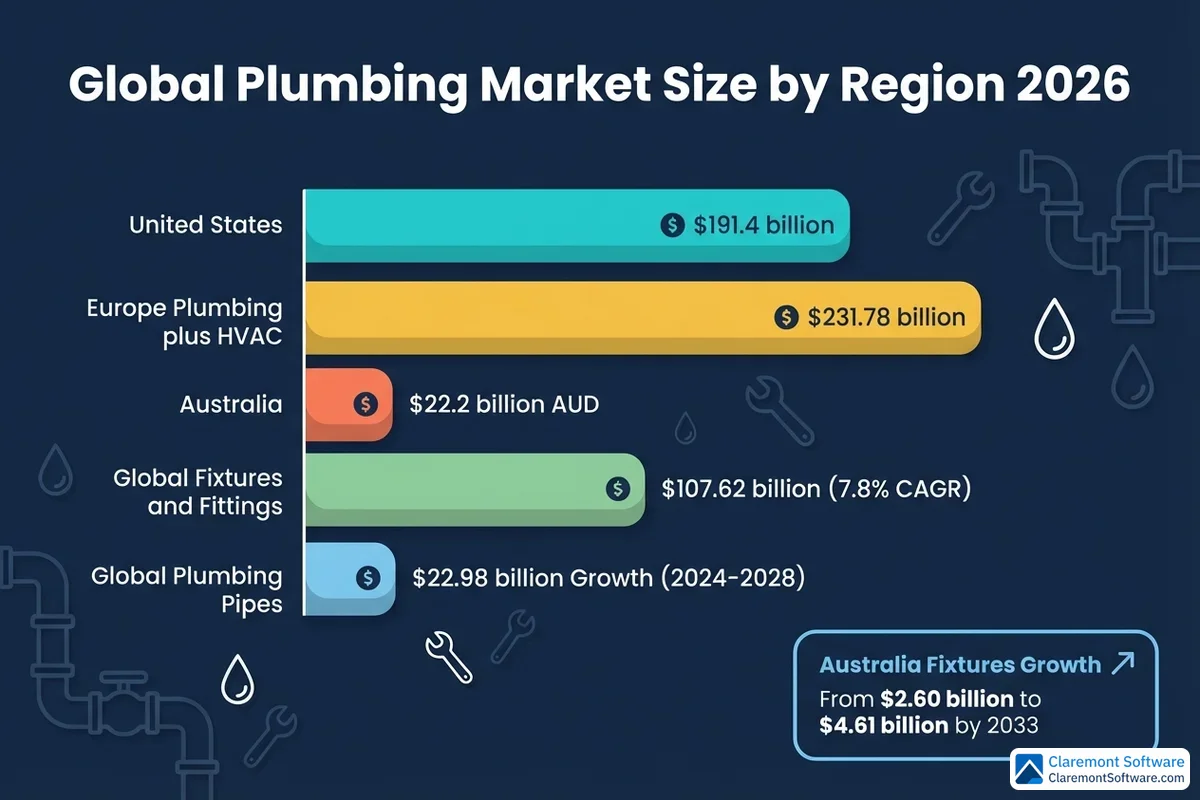
The global plumbing fixtures and fittings market is currently valued at $107.62 billion, advancing at a plumbing industry CAGR of 7.8% through 2028 and projected to reach $145.16 billion by the end of that period. This plumbing fixtures market size trajectory reflects rising urbanization, infrastructure investment, and growing middle-class demand for modern sanitation across developing economies — particularly throughout Asia-Pacific, where construction activity continues to outpace Western markets by a considerable margin. The plumbing industry economic impact at this scale extends well beyond installation labor, rippling through manufacturing supply chains, raw materials sourcing, and municipal infrastructure planning across dozens of national economies.
Europe tells a more complicated story. The European plumbing and HVAC installation market is valued at a substantial €219.1 billion ($231.78 billion) — making it larger in absolute terms than many observers expect — but the sector has actually declined at a CAGR of 2.7% since 2019. Energy cost volatility, slowing construction activity, and economic headwinds across key markets like Germany and France have weighed on the sector, even as demand for energy-efficient systems creates pockets of growth within it. The contrast with pre-pandemic plumbing trends from 2019 is stark: what looked like a stable, modestly expanding European market has since been reshaped by inflationary pressure and shifting construction priorities.
Australia represents one of the more compelling international comparisons for U.S. trade professionals. The Australian plumbing services industry is projected to reach AUD $22.2 billion in 2026, supported by 28,615 plumbing businesses and annualized revenue growth of 2.0% over five years — a steady, if measured, expansion that mirrors the kind of mature-market dynamics increasingly visible in parts of the United States. Australia's fixtures segment adds another dimension to the plumbing market size in 2026 conversation: currently valued at $2.60 billion USD in 2024, it's projected to reach $4.61 billion by 2033 at a 5.90% CAGR, reflecting strong underlying demand driven by residential construction and renovation activity. These plumbing business statistics underscore how even mid-sized national markets can sustain meaningful long-term growth when population trends and housing demand align.
Emerging plumbing marketing trends also differ meaningfully by region. In Asia-Pacific markets, digital procurement platforms and prefabricated system components are reshaping how contractors source materials and win commercial bids. In Australia and the U.K., service-based business models — including maintenance contracts and subscription-style inspection programs — are gaining traction as a hedge against project-based revenue volatility. These shifts carry direct implications for plumbing marketing trends in the U.S., where forward-looking firms are watching international adoption curves closely before committing to new service delivery models.
The plumbing industry outlook for 2026 at the global level is cautiously optimistic. While the size of the U.S. plumbing market remains dominant in absolute terms, the highest growth rates are concentrated in developing regions where baseline infrastructure investment is still accelerating. For manufacturers, distributors, and capital allocators evaluating where to deploy resources, Asia-Pacific and Australia represent the highest-momentum opportunities — while mature Western markets compete primarily on technology adoption, efficiency, and service quality rather than raw volume expansion. Understanding where each region sits on that curve is increasingly essential context for anyone relying on plumbing industry statistics to guide long-range planning.
Conclusion
The U.S. plumbing industry's $191.4 billion revenue in 2026 tells a story of fundamental strength — but the 0.4% year-over-year growth rate signals something equally important: this is no longer a market where rising tides lift all boats. Strategic positioning now separates the businesses that thrive from those that merely survive.
The data points toward five realities that every plumbing professional should internalize. The labor shortage of 500,000+ plumbers isn't resolving itself — but businesses that invest in workforce development will convert that crisis into competitive advantage. Smart plumbing technology and water conservation mandates are creating revenue streams that didn't exist five years ago. The shift toward remodeling is structural, not cyclical. And cost inflation of 28.4% on fixtures since 2021 demands modern pricing discipline — the kind that job-costing tools like Claremont Software are built to support.
Whether you operate a single service van or manage a multi-crew commercial operation, the fundamentals of this industry remain sound. But 2026 and beyond will reward the plumbing businesses that adapt — on workforce, technology, and pricing — over those that simply wait for conditions to improve.
Related Reading
- Plumber Digital Marketing: The Complete Guide
- How to Start a Plumbing Business: Complete Guide
- Google Business Profile for Plumbers: Complete Guide
Frequently Asked Questions
How big is the plumbing industry in the United States in 2026?
The U.S. plumbing industry is estimated to generate $191.4 billion in revenue in 2026, making it the seventh-largest construction industry by market size. The industry encompasses approximately 129,000 businesses and has grown at a compound annual growth rate (CAGR) of 3.1% over the past five years. The U.S. plumbing fixtures and fittings segment alone is valued at $18 billion. The industry is highly fragmented, with no single company holding more than 5% market share, and nonresidential construction accounts for just over two-thirds of total industry revenue.
What is the projected growth rate of the plumbing industry?
The U.S. plumbing industry has grown at a CAGR of 3.1% over the past five years, though growth is expected to slow to 0.4% year-over-year in 2026 — reflecting a maturing market. The number of plumbing businesses has grown at a more modest CAGR of 1.6% between 2021 and 2026. Globally, the plumbing fixtures and fittings market is growing faster, at a CAGR of 7.8% through 2028. Emerging technology segments are growing even more rapidly, with the smart toilet market expanding at a 9.89% CAGR and the plumbing pipes market projected to grow at 14.69% CAGR through 2028.
How many plumbers are there in the U.S., and is there a shortage?
There were 504,500 plumber, pipefitter, and steamfitter jobs in the U.S. in 2024, with employment projected to grow 4% from 2024 to 2034, adding approximately 22,700 new positions. Despite this growth, the industry faces a severe labor shortage of more than 500,000 plumbers — a 55% shortage rate — which is expected to worsen to 550,000 by 2027. Around 44,000 annual job openings are projected over the decade, driven by retirements, career changes, and new demand. The shortage is fueled by an aging workforce, a cultural preference for four-year college degrees, and an insufficient apprenticeship pipeline.
What is the average salary for a plumber in 2024–2026?
According to the Bureau of Labor Statistics, the median annual wage for plumbers, pipefitters, and steamfitters was $62,970 in May 2024, equating to approximately $30.27 per hour. The average reported salary sits slightly lower at around $60,227. Compensation varies significantly by region, specialization, and experience — commercial and industrial plumbers typically earn more than residential service plumbers. Plumber wages have been rising faster than many other occupations due to the ongoing labor shortage, making plumbing one of the most financially attractive skilled trades, especially when compared to the cost and debt burden of a four-year college degree.
What are the biggest trends shaping the plumbing industry in 2026?
Several major trends are reshaping the plumbing industry in 2026. The labor shortage of 500,000+ plumbers remains the most pressing challenge, pushing wages higher and forcing businesses to invest in recruitment and apprenticeship programs. Smart plumbing technology — including connected leak detectors, smart toilets, and whole-home water management systems — is a fast-growing segment. Water conservation mandates and eco-friendly plumbing solutions, such as high-efficiency fixtures and heat pump water heaters, are creating new service categories. On the construction side, commercial sectors like data centers and healthcare are outperforming, while multifamily housing remains soft. Cost inflation on fixtures and fittings — up 28.4% since 2021 — is also forcing plumbing businesses to modernize their pricing strategies.
How much does the plumber labor shortage cost the U.S. economy?
The plumber labor shortage costs the U.S. economy an estimated $33–$38 billion annually. This staggering figure reflects the cumulative impact of delayed construction projects, higher service costs passed on to consumers, and deferred maintenance on aging infrastructure. The shortage — currently estimated at more than 500,000 plumbers and projected to reach 550,000 by 2027 — is driven by an aging workforce, decades of cultural emphasis on four-year college degrees over the trades, and an apprenticeship pipeline that hasn't kept pace with demand. Plumbing businesses that proactively invest in workforce development and retention stand to gain a significant competitive advantage.
What is the global plumbing fixtures and fittings market size?
The global plumbing fixtures and fittings market is currently valued at approximately $107.62 billion and is projected to grow at a CAGR of 7.8% through 2028, reaching an estimated $145.16 billion. The U.S. plumbing fixtures and fittings segment alone accounts for $18 billion of that total. Regionally, the European plumbing and HVAC installation market is valued at approximately €219.1 billion ($231.78 billion), though it has declined at a CAGR of 2.7% since 2019. The Australian plumbing fixtures market is valued at $2.60 billion in 2024 and is projected to reach $4.61 billion by 2033. Asia-Pacific and Australia are showing particularly strong growth momentum.
How are rising material costs affecting plumbing businesses?
Rising material costs are one of the most significant financial pressures facing plumbing businesses today. Supply chain disruptions pushed the cost of fixtures, fittings, and trims up 28.4% between January 2021 and November 2025, with an additional 7.1% spike recorded from December 2024 to November 2025 alone. The Producer Price Index for plumbing and HVAC contractors reached 183.524 in February 2026, reflecting sustained industry-wide cost pressure. Many plumbing businesses initially absorbed these increases when older bids locked in lower prices, but most have since passed higher costs on to customers. Ongoing tariff uncertainty and global supply chain volatility continue to create pricing challenges. Businesses that adopt dynamic pricing strategies and use job-costing software — such as tools offered by Claremont Software — are better positioned to protect their profit margins.